Stanley McMillen, PhD, Consulting Economist, Managing Economist of the Department of Economic and Community Development (retired), and Associate Director of the Connecticut Center for Economic Analysis (retired)
Summary
The 2023 Connecticut Department of Revenue Services Tax Incidence Study examines the impact of Connecticut’s variety of taxes on households. We note the study contains several errors and heroic assumptions (all corporation and property taxes are completely borne by households); nevertheless, it concludes that Connecticut’s tax system is overall regressive. The personal income tax – which is moderately progressive – is less progressive than it was because the state has reduced its share of the Earned Income Tax Credit (EITC) over the past 10 years. While the. study’s required assumption of a 100% pass-through distorts the tax picture in the state, the study provides an alternative 50% pass-through view. Each view distorts the tax impact towards greater regressivity than may be the case.However, all Connecticut’s taxes except the personal income tax are regressive by definition because they are flat taxes. While the state has made tax changes that alleviate the regressivity of the sales tax for example, property taxes are inherently regressive, and little has been done to alleviate the impact on lower-income households (for example, fully funding payment-in-lieu-of taxes or PILOT and the Educational Cost Sharing formula). Further, there appears to be capacity in the top 5% income group to raise additional revenue that could support early child education and incentives for additional affordable workforce housing as examples. While perhaps beyond the scope of this study, it could be instructive to examine the potential tax lost through loopholes.
Background
Every two years the Connecticut Department of Revenue Services (DRS) is required by statute to provide an analysis of the incidence of various tax types. These tax types include the personal income tax (PIT), the corporation business tax, the sales and use tax, the property tax, the excise tax, and other taxes generating more than $100 million annually. In addition to the 2023 tax incidences, the report looks at the trends in incidences of these taxes from tax years 2011 through 2020. Tax incidence defines on whom a particular tax is levied. The report looks at the legal and economic incidences of the taxes mentioned. The legal incidence of a tax is the burden borne by the party that pays the tax to the state or municipality. The economic incidence includes the legal incidence plus the pass-through of a tax that can be allocated to a party other than the party that pays the tax directly to the state or municipality. Examples of pass-through are the sales tax on food consumed at restaurants and the excise tax on gasoline. The amount of pass-through varies by tax type and the ability of the legally responsible party to export the tax to non-residents and entities outside Connecticut. The report assumes a 100% pass-through for modeling the economic incidence of certain taxes. While one can quibble about the degree of pass-through used, the study’s authors provide a 50% pass-through incidence analysis for comparison. It should be noted that the legal and economic incidences of the PIT are the same as they fall on individual tax filers with no pass-through.
The statute requires the incidences to be reported by income decile and by other taxpayer characteristics determined by the DRS Commissioner. This report examines incidences by income and population deciles. The income measure used to create the income deciles is adjusted gross income, or AGI, determined on the federal tax return. AGI represents income from all sources less expenses the taxpayer paid for that the government deems should not be taxed. Examples include half of the self-employment taxes one pays, self-employed health insurance premiums, contributions to certain retirement accounts (such as a traditional IRA), student loan interest paid, and educator expenses. Such expenses and losses on business or capital (e.g., an apartment complex) adjust gross income (downward) to arrive at AGI.
The report points out a potential problem with income decile one. This decile includes very low-income households and those with business and/or capital losses that reduce their AGI to less than or equal to zero. The study includes this latter group in decile one “causing this study to show a much higher tax burden than it could be [in decile one].” (Underlined emphasis in the report). It would be instructive to exclude this group from decile one to see how the tax burden in decile one changes. The study correctly points out that not all income earners file a Connecticut tax return and that certain income from government programs such as SNAP (food stamps), housing assistance, and healthcare assistance, among other programs, may not be accounted for as such ‘income’ is not required on CT-1040 forms. Therefore, the data is not collectively exhaustive; however, the omissions are likely quite small compared to the available tax data used in the study.
The Suits Index is a commonly used measure to assess the progressivity of a tax with a calculated value of -1 representing a perfectly regressive tax, +1 representing a perfectly progressive tax and zero representing a flat or proportional tax. It should be noted that a flat tax is a regressive tax. The study correctly points out that the Suits Index may not account for non-tax revenue, tax exemptions, supplemental income from government programs or other target interventions that alter the fairness and incidence distribution of a tax system.
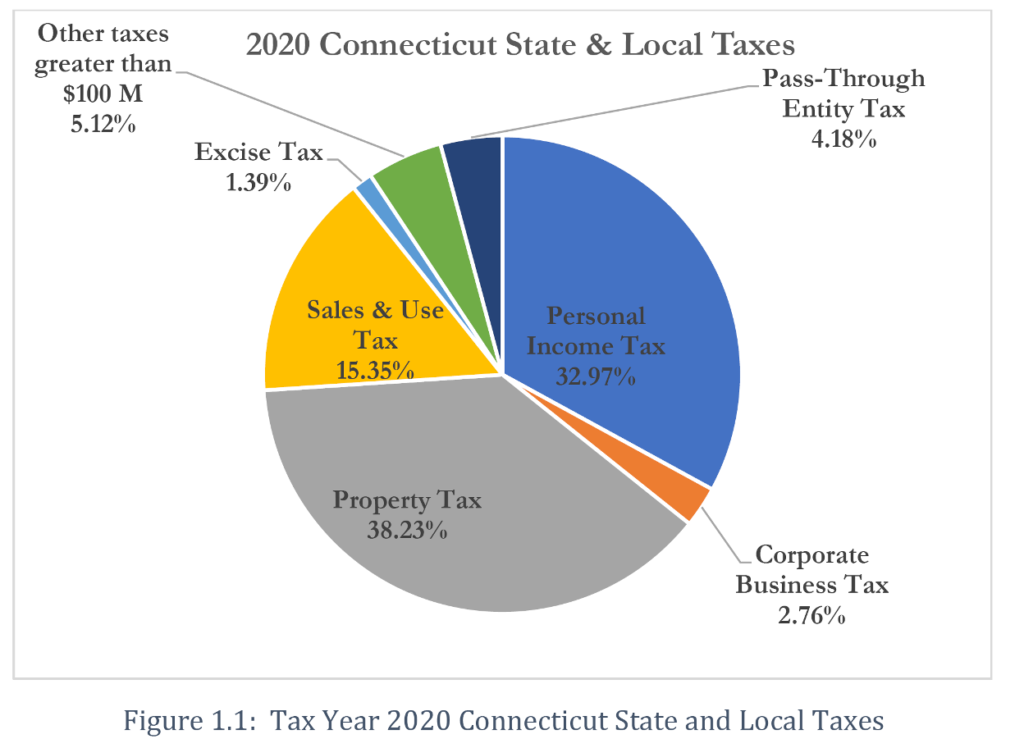
The following chart from the report shows the 2020 distribution of Connecticut’s state and local tax revenues. State-levied taxes yielded $19.10 billion while local taxes yielded $11.82 billion.
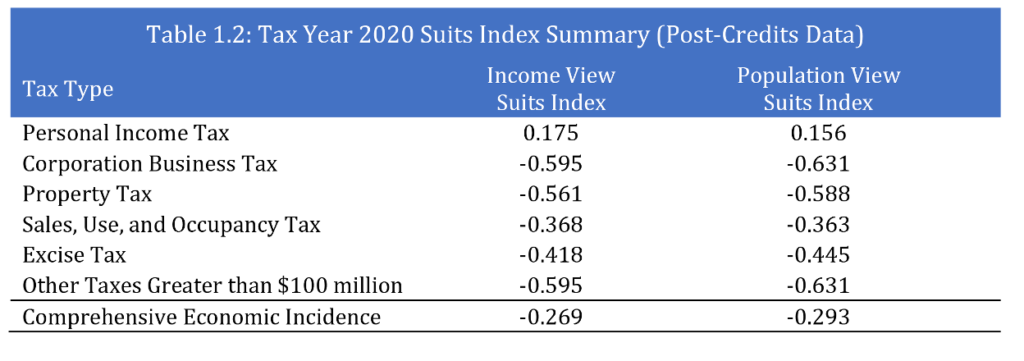
The following table from the report shows the progressivity for each tax type and for all tax types combined. This analysis shows that all tax types except for the PIT are regressive and overall, the Connecticut tax system is regressive. In this perspective (Table 1.2 from the report), the analysis uses 100% pass-through for applicable taxes.
Personal Income Tax
The PIT is inherently progressive as the report provides the rates for each filing type and income level (the sales, excise and the pass-through allocation from the corporation business tax are flat taxes and therefore inherently regressive). It is noteworthy that 45.3% of Connecticut’s individual AGI ($87.34 billion) was reported by the top 5% of reporting households in 2022. These households paid $5.8 billion or 57.3% of Connecticut’s PIT revenue. In the population decile perspective, the effective PIT rate for the top 5% to the top 1% was 6.16%, while the effective rate for the top 1% to the top 0.55 was 6.95% and for the top 0.5% of individual filers, the effective rate was 6.99%. The report notes the effect of credits (pre- and post-) on the effective PIT rates borne by each income and population decile. Unsurprisingly, the credits applied reduce the effective rates for the deciles that qualify for credits against their income taxes and make Connecticut’s PIT structure more progressive than it would be without credits (the two credits considered in this report are the refundable EITC and the non-refundable property tax credit).
The PIT trend analysis shown in the report’s Tables 2.9 and 2.10 shows that the PIT after credits are applied has become less progressive over the decade 2011 through 2020. This is due to changes in the EITC and property tax credit as well as changes in the Pass-Through Entity Tax and Pass-Through Entity Tax. Notably, Connecticut successively reduced its contribution to the EITC from 30% of the federal amount in 2011 to 23% in 2020. These tables appear to have calculation errors and it is difficult to follow the author’s methodology. Notwithstanding these issues, the declining progressivity trend is clear.
Corporation Business Tax
In their analysis of the corporation business tax, the authors provide a scenario in which they assume that it is shifted entirely (passed through) to households (individual tax filers) uniformly. That is, the 2020 post-credit aggregate corporate business tax revenue of $852 million is divided into 10 equal parts with each part equally borne by an income decile. In a second scenario, they assume half of the $852 million is passed through to individual filers distributed as above. In each case, the effect is to greatly increase the effective tax burden lower-income households experience due to this tax. Further, this analysis ignores the business-to-business sales of goods and services on which taxes must be paid (the 50% pass-through attempts to mitigate the skew). The authors recognize the (severe) limitations of their pass-through assumptions and recommend a more nuanced analysis of how the corporation business tax impacts Connecticut filers. For example, some corporations export their tax burdens out-of-state and some produce goods no consumer buys (airplane engines and submarines).
Property Tax
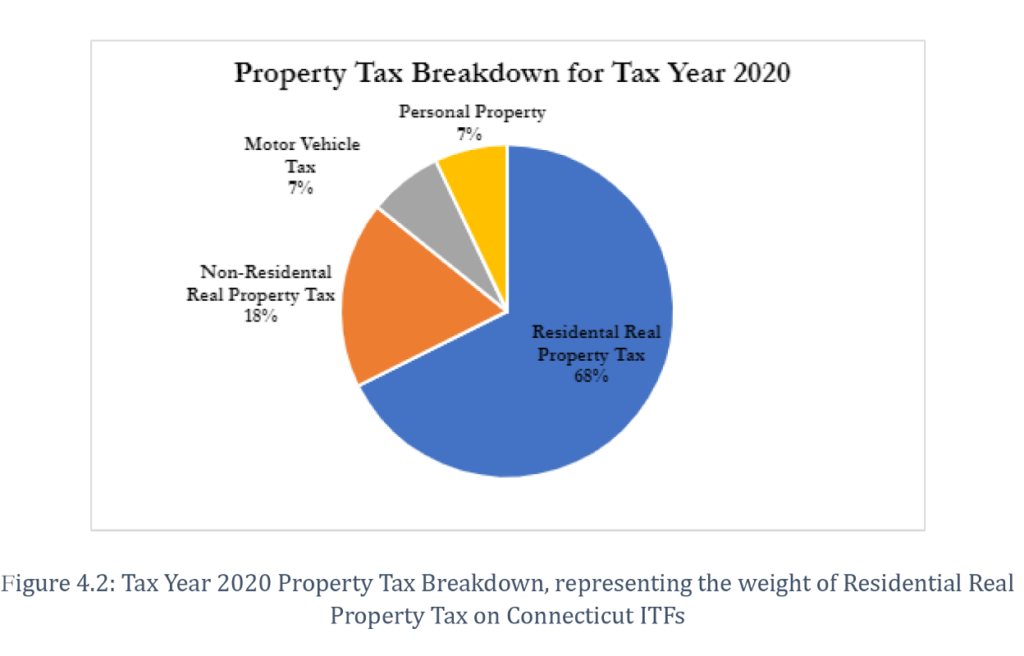
Like the corporation business tax, the authors assume 100% of all property taxes fall on individual tax filers. The following figure from the report shows that while 68% of property tax receipts arise from residential property, the remaining 7% each from motor vehicles and personal property, and 18% from non-residential property (commercial, industrial, and agricultural) or 32% of total receipts are assumed to be passed through to households.
This is a heroic assumption. The authors provide no other scenario. It does not make sense to allocate property taxes on corporate motor vehicle fleets, industrial equipment, or commercial and industrial buildings to households. A portion of these taxes is exported to other businesses and to non-resident consumers (rental cars, delivery vehicles, jet engines). It would be more helpful to examine the burden borne by households exclusively due to the property taxes they pay. Indeed, the presence of commercial and industrial establishments in municipalities is welcomed as an offset to residential property tax burdens. Given the authors’ approach, it is understandable that the property tax is regressive. While there is undoubtedly a correlation between income and property taxes (higher-income households are more likely to own or rent higher-value homes or apartments), the reality is that some families are overhoused (they pay more than 30% of their income on housing) while others are underhoused. Home values can fluctuate widely and rapidly over time (cool markets can heat up and vice versa, and then there’s location, location, location). Further, rents incorporate property taxes, and it is not clear how to consider renters’ property tax burdens vis-à-vis non-renters. Further, there are two methods of assessing property value: the income derived from the property and the comparable value of similar properties recently sold. These methods may yield different assessments on the same property.
Sales and Use Tax
The authors provide a reasonable analysis of the sales and use tax. Acknowledging that part of this tax is paid by non-residents and businesses outside Connecticut, the authors use the Consumer Expenditure Survey to construct a menu of goods and services purchased by Connecticut households of different incomes. They organize survey respondents into income deciles and calculate the mean and median expenditure of each decile to determine the ratios of expenditure to income by decile. These ratios distribute the sales and use tax burden to each income decile. Despite the variety of Connecticut’s sales and use tax rates that provide a measure of progressivity, the analysis shows the significant regressivity of this tax. This suggests that it may be possible to implement additional exemptions and sales and use tax rates to alleviate the burden of this tax on low-income households. Further, it is not clear whether the use tax, which is self-reported on out-of-state purchases is entirely accounted for in the data. For example, some businesses located in other states may not have established nexus with Connecticut and therefore do not remit tax on their sales to Connecticut residents. Higher-income households may do more business with out-of-state enterprises and thus avoid the use tax. It would be helpful for the authors to mention and explore the issue.
Excise Taxes
Excise taxes are levied on the quantities sold of certain goods such as cigarettes, alcohol, tobacco products, and motor fuel. They are levied on the businesses that sell the goods and are passed on to consumers. Excise taxes are inherently regressive. The legal incidence falls on purchasers of these products via higher prices. The procedure for allocating the economic incidence of excise taxes is like that used in the sales and use tax distribution of burden (100% pass-through). Using the Consumer Expenditure Survey for calculating the expenditure on such goods to income ratios, the authors distribute the burden to ten income deciles. As with their other tax burden calculations, decile one bears a disproportionately higher burden than the other nine deciles in both the mean and median income perspective. In fact, the first three deciles bear 60% of the state’s excise tax burden.
Taxes Greater than $100 Million
If companies in certain sectors or certain tax types generated $100 million or more in tax revenue in tax year 2020, their tax impact must be analyzed as other tax types are in this study. The sectors and tax types that satisfy this threshold are insurance, public service, the estate and gift tax, motor vehicle fuels, real estate conveyance tax, and petroleum products.
Public service companies include cable, satellite, electricity, and gas suppliers, and antenna television companies (81 companies total). The tax such entities face is on their gross earnings, and the authors distribute the aggregate tax of $253.4 million uniformly across all taxpayers, irrespective of income. The authors recognize that this is a gross simplification as lower-income households may opt for bundles of public services that are significantly less costly than the average burden the authors allocate to them. The analysis shows that this allocation is regressive.
The motor fuels tax is again equally divided among all taxpayers irrespective of income. This approach ignores reality as they recognize the impact on businesses that can export part of their burden. The authors recommend that future studies account for the impacts on consumers and businesses as their responses to price increases or tax changes are different and interact.
The Petroleum Products Gross Earnings Tax applies to gasoline, aviation fuels, kerosene, diesel, heating oil, greases, lubricants, mineral oil, and motor oil. Again, this tax ($165.3 million in 2020) is distributed equally among all taxpayers, which the authors recognize is “very naïve”. Clearly, businesses purchase these products and can export tax part of their tax burdens.
It is unclear why the authors distribute the Estate and Gift taxes across the spectrum of taxpayers irrespective of income when they admit it is the estate that pays the tax or the giver of a gift that exceeds $15,000 (per recipient) who pays the gift tax. These taxes are borne by relatively high-income filers and burdens should be distributed to payers of the tax exclusively. In addition, the description of these taxes is inconsistent with the Office of Legislative Research Report 2020-R-0224.
As with the Estate and Gift taxes, the Real Estate Conveyance Tax is paid by the seller of the property and should not be distributed to all taxpayers as no pass-through is possible.
The authors do not attempt to distribute the Insurance Premiums tax as it makes no sense to do so. However, some analysis is warranted because insurance purchasers do experience some pass-through of taxes levied on the provider companies.
Conclusion
The 2023 tax incidence study concludes that Connecticut’s tax is overall regressive, while the PIT is demonstrably progressive, the aggregate structure is tilted toward regressivity due to other taxes. If the authors had not assiduously distributed almost every tax uniformly and completely (100% pass through) to the income and population deciles, the overall fairness perspective would likely be altered perhaps in favor of less regressivity than the authors estimate. The authors recognize the deficiency of their approach and commendably recommend changes in future studies. They recognize the deficiencies in their approach to taxes borne by part-time and non-residents; for example, there are not insignificant numbers of Connecticut taxpayers who live in the state and work elsewhere and those who live elsewhere and work in the state. The narrative states they account for non-residents, but they don’t, an oversight an editor would have caught. Finally, the authors recommend using historical data to forecast the potential impacts of tax changes and, in addition, conducting a comparative tax analysis with other regions. This reviewer suggests future analysts use a dynamic economic model of the state and region to assess the economic impact of changes on consumer and business behavior including migration and the consumption of substitutes.
